RELATIONSHIPS FOR SELF PROPELLED UNDERWATER VEHICLES IN STEADY MOTION – by Calvin A. Gongwer
ABSTRACT
A method is given for estimating propulsion performance for underwater vehicles in which the effect of the vehicle wake is taken into account. Computation charts for use of designers are included. The method is generalized so that it is applicable to aircrafts as well. Certain coefficients are used which require estimation and judgment to assign values and which form a basis for future studies.
DISCUSSION
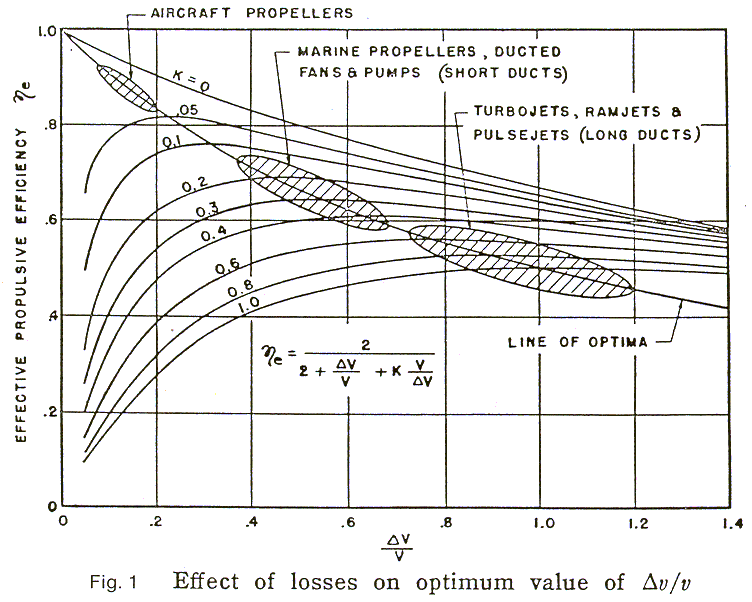
A relationship for optimizing propulsion was given by the author in Ref. 1. The effect of losses caused by the flow thru and around the thruster was derived in terms of propulsion efficiency and the jet velocity ratio, DV / V. Where DV is the difference between the relative jet exit velocity, Vj, and the forward speed, V. The losses were represented as a factor, k, of the entering velocity head, V2 / 2g.
Fig. 1 from Ref. 1 is reproduced here as Fig. 1. The curves show that there is an optimum range for DV / V for each type of propulsor including ducted fans, open propellers and jet engines. In general a system with a long duct with comparatively great wetted area, inside and outside, must be operated at a higher value of DV / V than a system with a comparatively small wetted area such as an aircraft propeller. This is in order not to have the efficiency degraded excessively by the losses accompanying the handling of large amounts of the fluid medium. In all of the above the thruster is assumed to be operating in the free stream which means that the entering fluid has the energy and momentum of the free stream.
In this paper the above analysis is extended to include the effect of inducting all or part of the wake of the vehicle into the thruster. Also, the efficiencies derived must be multiplied by the equivalent efficiency of the thruster as a pump or fan in order to obtain the overall propulsive efficiency which is defined as thrust times forward speed divided by shaft power input.
ANALYSIS
Maloof, et al (Ref. 2) have shown that the jet velocity ratio, DV / V, can be replaced by the parameter, At / CDAV, where At is the total cross section area of the jets issuing from the thrusters and CDAV is the equivalent flat plate drag area of the vehicle. CDAV is defined as drag divided by dynamic pressure.
|
CDAV = Drag / ½ rmV2 |
( 1 ) |
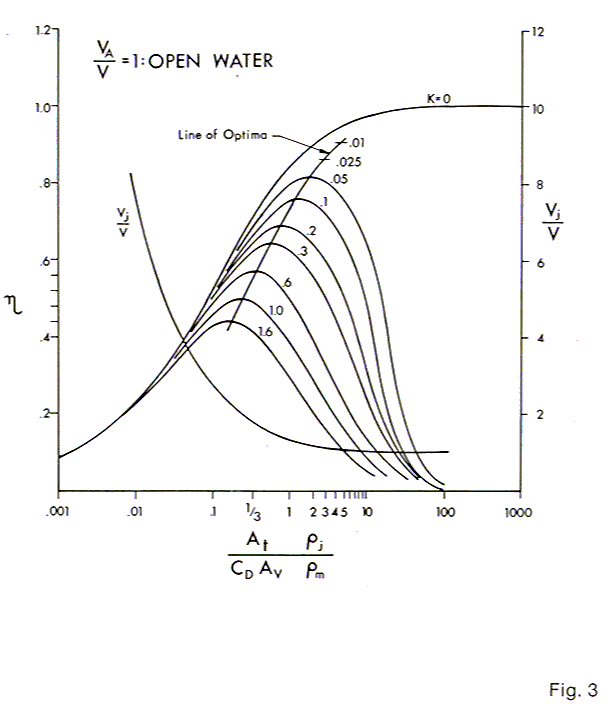
In Fig. 3, Fig. 1 has been transposed to the abscissa, At rj / CDAVrm. The curves for constant loss factors, K, and the line of efficiency optima as well as the ratio of relative jet velocity Vj, to forward speed, V, are shown.
A further generalization has been made to the abscissa. This is because the density of the jet, rj is not always the same as that of the fluid thru which the vehicle travels, rm. For example, the aircraft jet engine, or the under water steam ram jet, (Ref. 3). Thus the mass rate thru the system, , is defined as:
|
= At rjVj |
( 2 ) |
and the thrust in the free stream case is:
|
Thrust = At rjVj( Vj – V ) |
( 3 ) |
Since in steady motion the thrust is equal to the drag:
|
CD AV ½ rm V2 = At rj( Vj2 – VjV ) |
( 4 ) |
one obtains:
|
( At rj / CD AVrm ) = 1 / { 2( 1 – Vj / V ) } |
( 5 ) |
For the case of underwater vehicles rj = rm. However, for an aircraft jet engine the following is the case:
| rj / rm = Tm / Tj |
( 6 ) |
where Tm and Tj are the absolute temperatures of the outside air and the jet. Thus the abscissae are modified:
|
At / CD AV > At rj / CD AVrm |
( 7 ) |
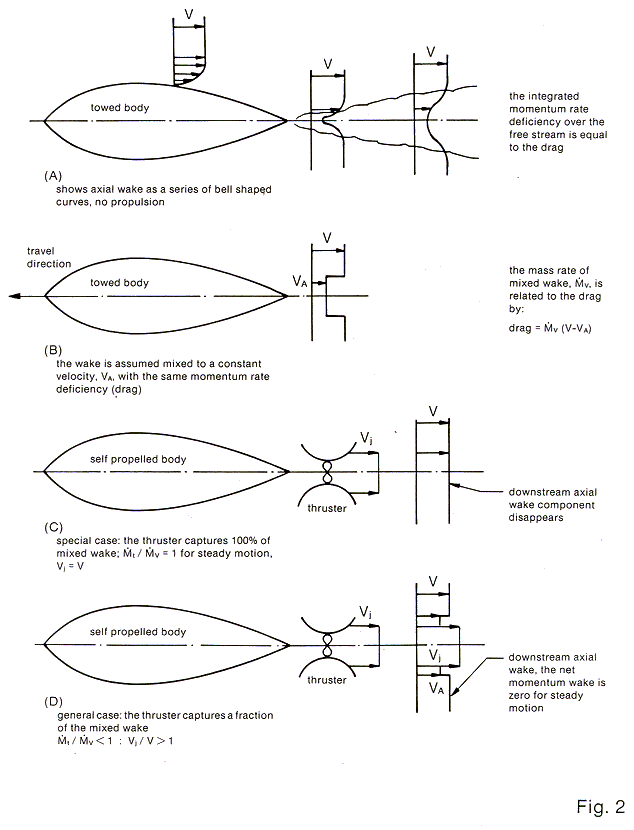
The analysis which gives the curves of Fig. 1 will now be extended to the case of thruster operation in the wake where the mean velocity of the water entering the thrusters has been reduced by the drag process on the vehicle. Fig. 2 gives diagrams of this. Fig. 2A shows the wake of a towed body as a series of bell shaped curves representing the distribution of mean axial velocities. At any station down the wake the integrated momentum rate deficiency is equal to the drag. This follows from the law of conservation of momentum.
In order to make things simple it is customary to represent the wake as a stream of a constant mean velocity, VA. This is shown in Fig. 2(B). The value of VA is given as follows:
|
Drag = V( V – VA ) |
( 8 ) |
Where V is the mass rate of the Mixed wake and V is the forward speed.
Fig. 2(C) shows a steadily moving self propelled body in which the mass rate thru the thruster comprises exactly the mass rate, V of the mixed wake. For the thrust to be equal to the drag:
|
t( Vj – VA ) = V( V – VA ) |
( 9 ) |
Where t is the mass rate thru the thruster and in this case is taken as equal to V. Then
|
Vj = V |
( 10 ) |
Thus the downstream axial momentum wake is made equal to zero and the wake disappears, at least its axial components. This represents the most efficient case of propulsion and, as shown below, the ideal efficiency can be greater than 100%. This doesn’t violate the law of conservation of energy as it might seem. It means that the thruster is inducting water which has been energized by the drag process on the vehicle.
Fig. 2(D) shows the case where the thruster inducts only a fraction of the mixed wake
|
t / V < 1 |
( 11 ) |
therefore
|
Vj / V > 1 |
( 12 ) |
The downstream wake looks diagrammatically as in the figure where the wake doesn’t disappear although the net axial momentum is again zero.
For those familiar with the propulsion analysis given in Ref. (4) which describes the thrust deduction and body resistance augmentation that result from the interaction between the propulser and the propelled body the following is offered. For the purposes of this analysis of energy efficiency these effects can be shown to be internally self canceling. The free body analysis used here is valid by the laws of conservation of momentum and energy.
Often the body is not streamlined but may be an ROV (remote operated vehicle) with an open framework on which are attached the component modules. In this latter case the phenomena are more complicated. However, the same relationships shown above apply where the thruster inducts both wake and free stream water. The value of VA is again given by equation ( 8 ).
The following is now derived with the proviso that the thrusters take in less than all of the mixed wake.
|
Drag = rm { ( CD AVV2 ) / 2 } |
( 13 ) |
|
Thrust = rj At Vj ( Vj – VA ) |
( 14 ) |
equating ( 13 ) and ( 14 ) and solving gives:
|
{ ( CD AVrm ) / ( At rj ) } = 2 ( Vj / V ){ ( Vj / V ) – ( VA / V ) } |
( 15 ) |
The useful power input to the water passing thru the thrusters is:
|
net input power = ½ rj At Vj ( Vj2 – VA2 ) |
( 16 ) |
net output power = thrust times forward speed
|
= rj At Vj ( Vj – VA ) V |
( 17 ) |
Therefore the generalized efficiency is given by:
|
h = 2 { ( Vj / V ) + ( VA / V ) } |
( 18 ) |
The loss factor K from Ref. 1 will now be introduced. K is defined as the fraction of the entering velocity head, VA2 / 2g , which is lost due to handling the fluid thru the thruster. It is made up of entrance diffuser losses, losses due to additional wetted area made necessary by the presence of the thrusters, flow interference losses, etc. The losses within the thruster itself when it is considered as a pump or fan are not included. These are taken account of by multiplying the efficiency from (18) by the pump or fan efficiency.
Thus the thruster inlet head is effectively:
|
Hi = ( VA2 / 2g ) ( 1 – k ) |
( 19 ) |
in energy per pound of fluid.
The exit head is:
|
He = Vj2 / 2g |
( 20 ) |
|
DH = ( V2 / 2g ) { ( Vj / V )2 – ( VA / V )2 ( 1 – k ) } |
( 21 ) |
The propulsion work per pound of fluid is:
|
( 1 / g ) V( Vj – VA ) = ( 1 / g )V2 { ( Vj / V ) – ( VA / V ) } |
( 22 ) |
Therefore (22) divided by (21) gives:
|
h = 2{ ( Vj / V ) – ( VA / V ) } / { ( Vj / V )2 – ( VA / V )2 ( 1 – k ) } |
( 23 ) |
Combining (23) and (15) gives:
|
h = { ( CD AV / At) ( rm /rj) } / { ( Vj / V )3 – ( VjVA2 / V3 ) ( 1 – k ) } |
( 24 ) |
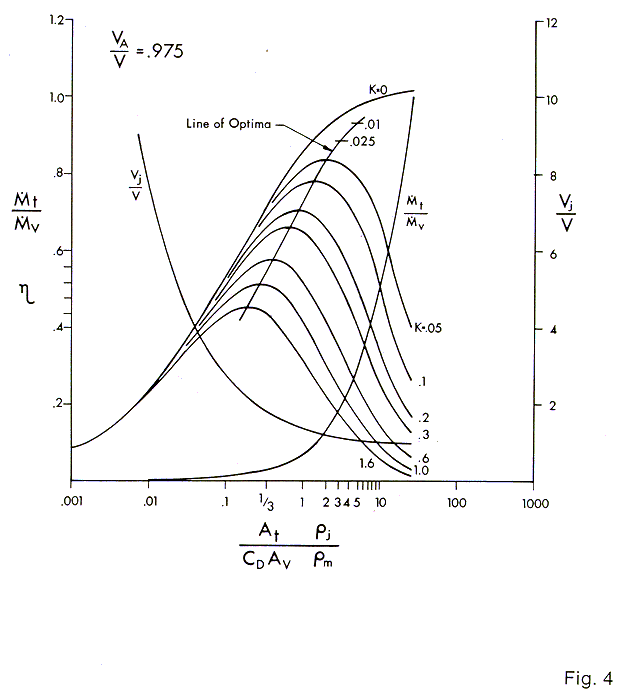
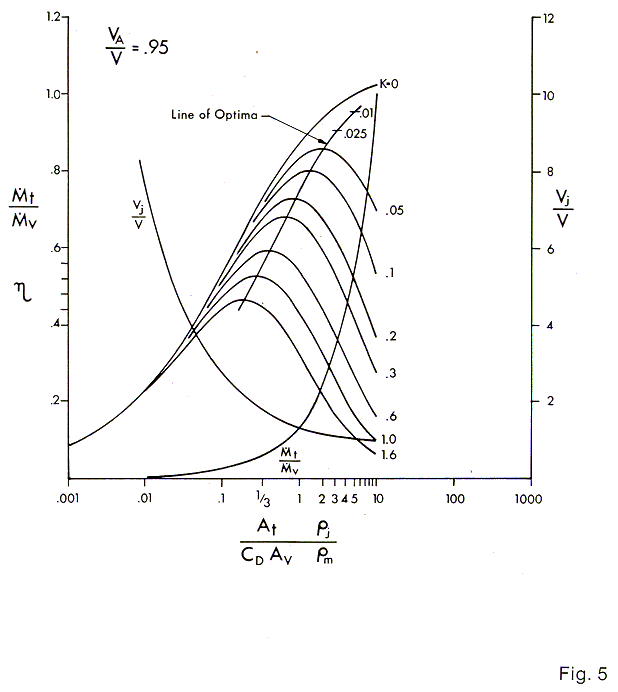
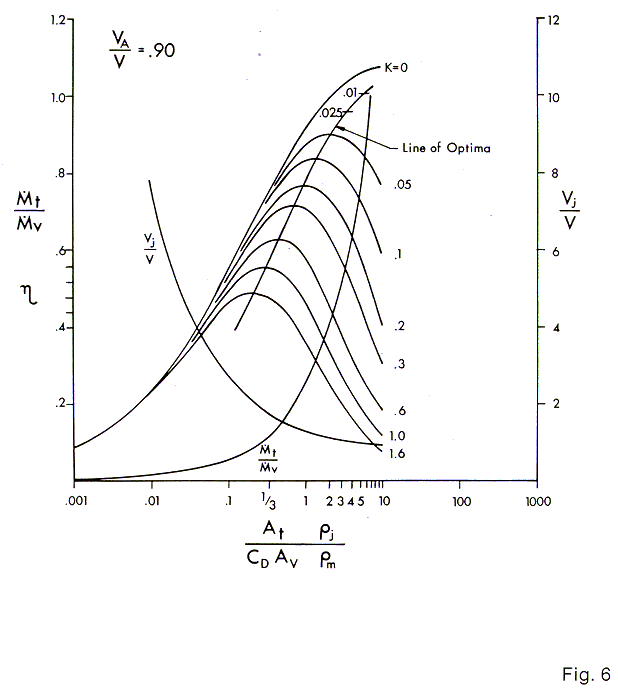
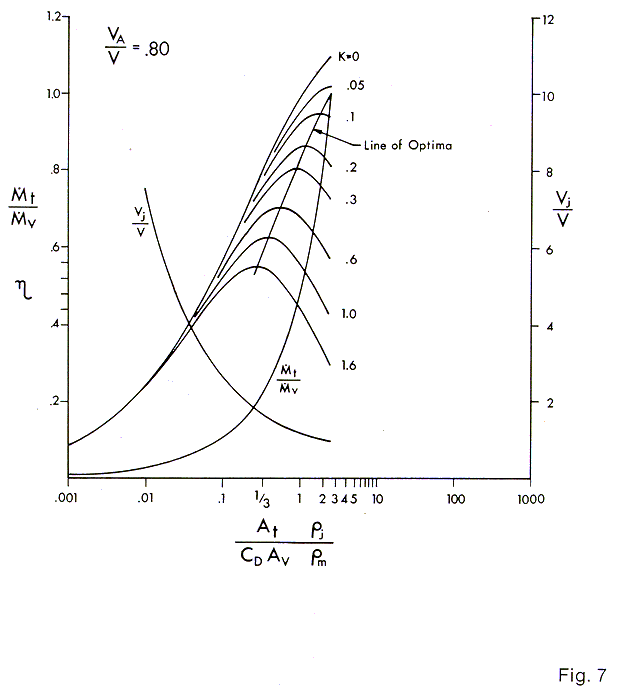
The curves of Figs. 3, 4, 5, 6 & 7 are plotted for values of VA / V of 1, .975, .95, .90, and .80 respectively. The curve of T / V, the fraction of the mixed wake passed thru the thrusters, is plotted also along with the values of Vj / V. The curves are not carried beyond a vertical line through the point T / V = 1. The solution loses practical significance beyond this value.
EXAMPLE OF USE OF THE CHARTS
Example:
We will estimate from a study of the vehicle type and the thruster disposition, ( whether they are far outboard or close in) that the value of VA / V is .95. The ratio of ri / rm = 1 for the case of water jets in water. The CDAV = 8 ft.2 as estimated from tests or paper analysis of the CD. The value of K is taken as .05. This value selection is discussed below. The value of At = 2.56 ft2. Since there are four propulsion thrusters, each one with an At of .64ft2. Therefore:
|
( At rj / CD AVrm ) = 2.56 / 8 = .32 |
The chart Fig. 5 is entered at .32 on the abscissa and a vertical line is drawn here. The intersection with the curves gives an efficiency of .71. The overall efficiency is then obtained by multiplying by the thruster efficiency as a pump, in this case a fixed 80%. Therefore the net overall efficiency is:
|
h o.a. = ehp / shp = .71 x .8 = 57% |
Further inspection of the intersections shows the value of
|
T / V = .045 and Vj / V is 1.8 |
It can be seen that the solution for h is not strongly influenced by the value of K, but as we move to the right by using more thrusters ( increasing At ), the efficiency, h improves for low values of K until an optimum is reached after which it decreases.
If the thrusters are inboard on an open frame ROV, the chart for VA / V = 0.8, Fig. 7 might be used, and if the other factors are the same as in the above, the efficiency would be .78 which when multiplied by the fixed pump efficiency of the thruster gives
|
h o.a. = .78 x .8 = 62.4% |
When compared with the above value of 57% for a VA / V of .95 the value of operating in the wake of the vehicle is readily apparent.
The designer will acquire experience in the selection of VA / V and K and will be able to make judicious estimates. For instance, if the thrusters are well outside the envelope of a streamlined vehicle the open water case, VA / V = 1 (Fig. 3) applies and K depends on the degree of external streamlining given to the nacelles and supporting struts and could well be .05, or less.
MANY SMALL THRUSTERS VS. FEWER LARGE ONES
The question of several small thrusters vs. one or two big ones of the same total At resolves itself usually to from 2 thru 6 thrusters. This is because the weight and bulk for a geometrically similar series of thrusters varies as the cube of the dimensions whereas the passage flow areas vary only as the square. Thus an array of several small thrusters weighs much less and is smaller in bulk than the equivalent large single thruster of the same At. Also the prop tip speeds will be the same at the same thrust meaning that the rpm is greater for the small units. For electric motors and to a lesser extent hydraulic motors this is a great advantage in avoiding gearing or very large motor weights. However, it should be mentioned that the larger thruster will be a few points more efficient because of the decrease of skin friction coefficient with size (Reynolds number).
REFERENCES
Reference 1.) “The influence of Duct Losses on Jet Propulsion Devices”, C.A. Gongwer, JET PROPULSION, Nov.-Dec. 1954.
Reference 2.) “A Brushless Electric Propulsion System for the Research Submersible ALVIN”, Roger H. Maloof, Ned C. Forrester and Charles E. Albrecht. Proceedings of OCEANS ’86.
Reference 3.) “Ramifications of the Rocket”, C.A. Gongwer. “Aircraft and Missiles”, April 1961.
Reference 4.) “Hydrodynamics in Ship Design”, Vol 1, Saunders SNAME.
